
Deep Dive Into Course Analytics in Canvas
Issue Date: 07-12-2019
Learning how to use the analytics available about your course in Canvas is critical, particularly with online courses, to understand student participation and engagement, as well as locating positive and negative trends. This will give you the information necessary to make revisions to improve overall course quality.
By using the built-in Canvas analytics, you can identify students who are struggling, problematic assessment questions, and get a handle on trends such as late submissions or erratic course participation.
Course Analytics
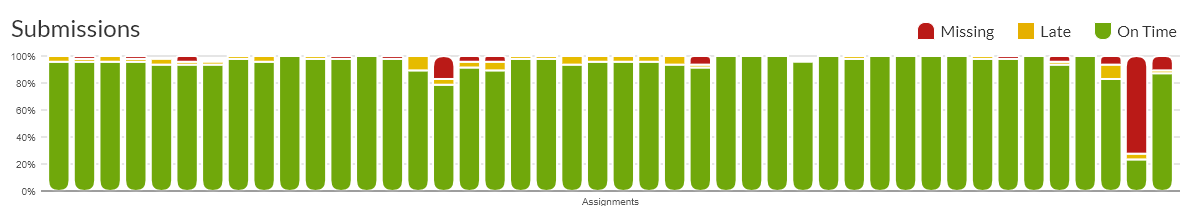
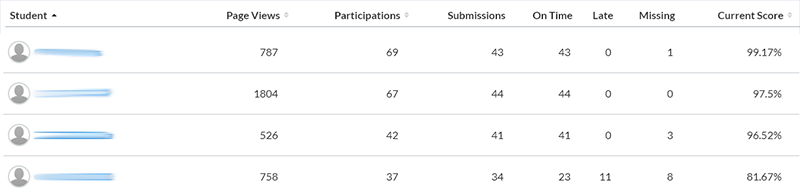
Course analytics will show you activity, assignment submissions, grades, and provide student statistics. You can view analytics in both active and concluded courses.
Note: The Analytics button only displays once students have been enrolled and students have started to participate in the course.
See How do I view Course Analytics for more information.
Individual Students
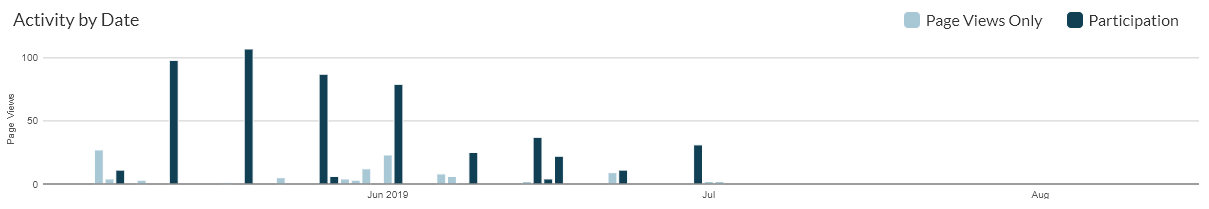
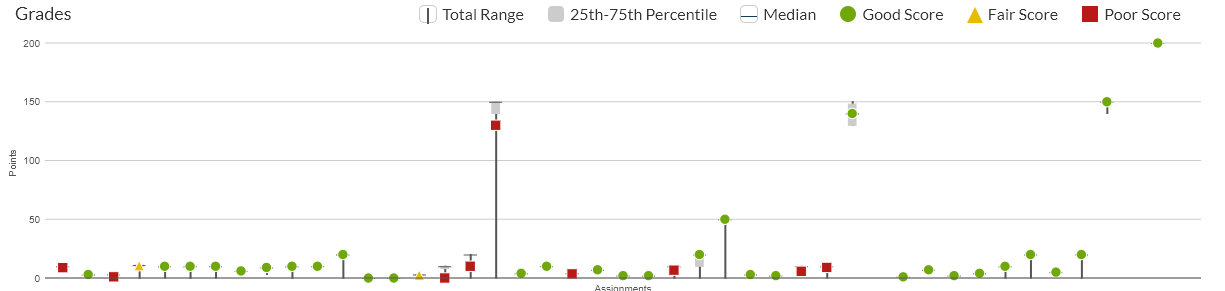
Viewing Individual Student analytics can provide a breakdown of Activity by Date, Communication, Submissions, and Grades.
See How do I view analytics for a student in a course for detailed instruction.
Quiz Statistics
Standard Quiz Statistics in Canvas summarize and breakdown quizzes on a question by question basis, allowing you to filter results to best suite details you are interested in.
If you are using the standard Canvas quizzes: choose a quiz, then click Quiz statistics under the Related Items menu.
See Once I publish a quiz, what kinds of quiz statistics are available for instructions.
Quizzes.Next
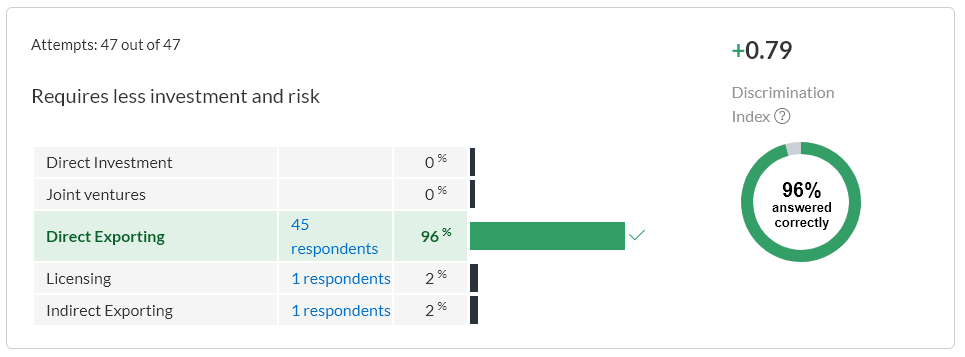
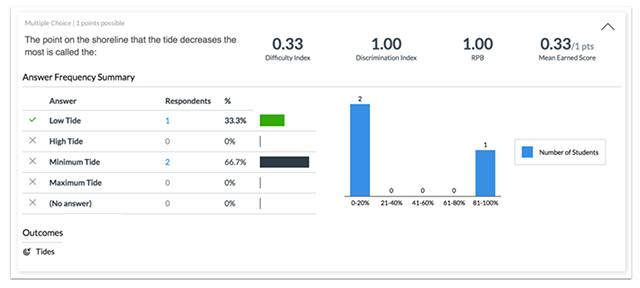
With Quizzes.Next, you are provided a Quiz and Item Analysis and Outcomes Analysis.
The Quiz Analysis includes statistics for overall assessment scores, including highest score, lowest score, mean score, standard deviation, mean elapsed time and Cronbach’s Alpha.
In the Item Analysis section, you can view statistics for specific questions in an assessment through Difficulty Index, Discrimination Index, RPB and Mean Earned Score.
The Outcomes Analysis includes each student who has completed an assessment and their mastery results for each outcome.
See How do I view reports for an assessment in Quizzes.Next for detailed instructions.
Tags: Canvas